 Want to see how the five districts in LA County compare on employment, household income, educational attainment, and more? Below, link to the PDF file that provides these useful infographics for each district.
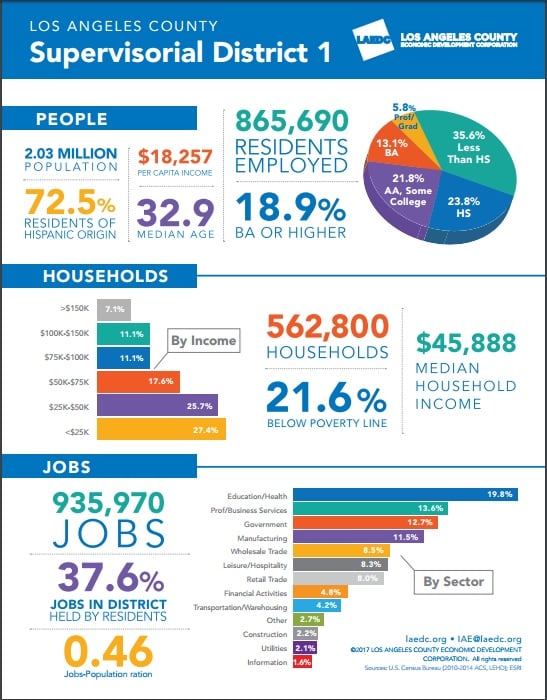
Download the demographic snapshot HERE.
For comparison, here are the averages for LA County in its entirety:
| Los Angeles County | |
| People | |
| Population, in millions | 10.15 |
| Median Age | 35.4 |
| Residents of Hispanic Origin | 47.7% |
| Per Capita Income | $28,565 |
| Residents Employed | 4,658,953 |
| Educational Attainment | |
| <High School | 22.2% |
| High School | 20.8% |
| AA, Some College | 26.1% |
| BA College Degree | 20.0% |
| Prof/Grad Degree | 11.0% |
| Households | |
| Households | 3,321,508 |
| Households below the poverty line | 16.9% |
| Median Household income | $57,190 |
| >$150K | 15.6% |
| $100K-$150K | 16.4% |
| $75K-$100K | 12.5% |
| $50K-$75K | 14.1% |
| $25K-$50K | 19.3% |
| <$25K | 22.0% |
| Jobs | |
| Jobs | 3,868,109 |
| Jobs/Population ratio | 0.38 |
| 80.7% of all jobs in the County are held by residents of the County | 80.7% |
| Jobs By Sector | |
| Utilities | 0.8% |
| Construction | 3.0% |
| Other | 3.6% |
| Government | 4.1% |
| Transportation/Warehousing | 4.1% |
| Information | 5.3% |
| Financial Activities | 5.7% |
| Wholesale Trade | 5.9% |
| Manufacturing | 9.0% |
| Leisure/Hospitality | 10.4% |
| Retail Trade | 10.4% |
| Prof/Business Services | 15.4% |
| Education/Health | 22.3% |
| 100.0% |
The post Demographic Snapshots for LA County’s Five Districts appeared first on Los Angeles County Economic Development Corporation.


